GIS and Data Viz
Maps are powerful storytelling tools—and my favorite form of data visualization! I love helping civic and nonprofit clients use them to spark understanding and action. I’ve built visualizations for city governments, grassroots campaigns, and policy researchers using tools like Mapbox, ArcGIS, and QGIS.

Police Pursuits Proposal
Maps traffic fatalities involving police pursuits, using NHTSA data, and suggests mapping as a tool to further study pursuit-related fatalities.
Map created QGIS 3.22.5 for a course project. The basemap uses OpenStreetMap and Census TIGER data. Poster created in Adobe Illustrator.
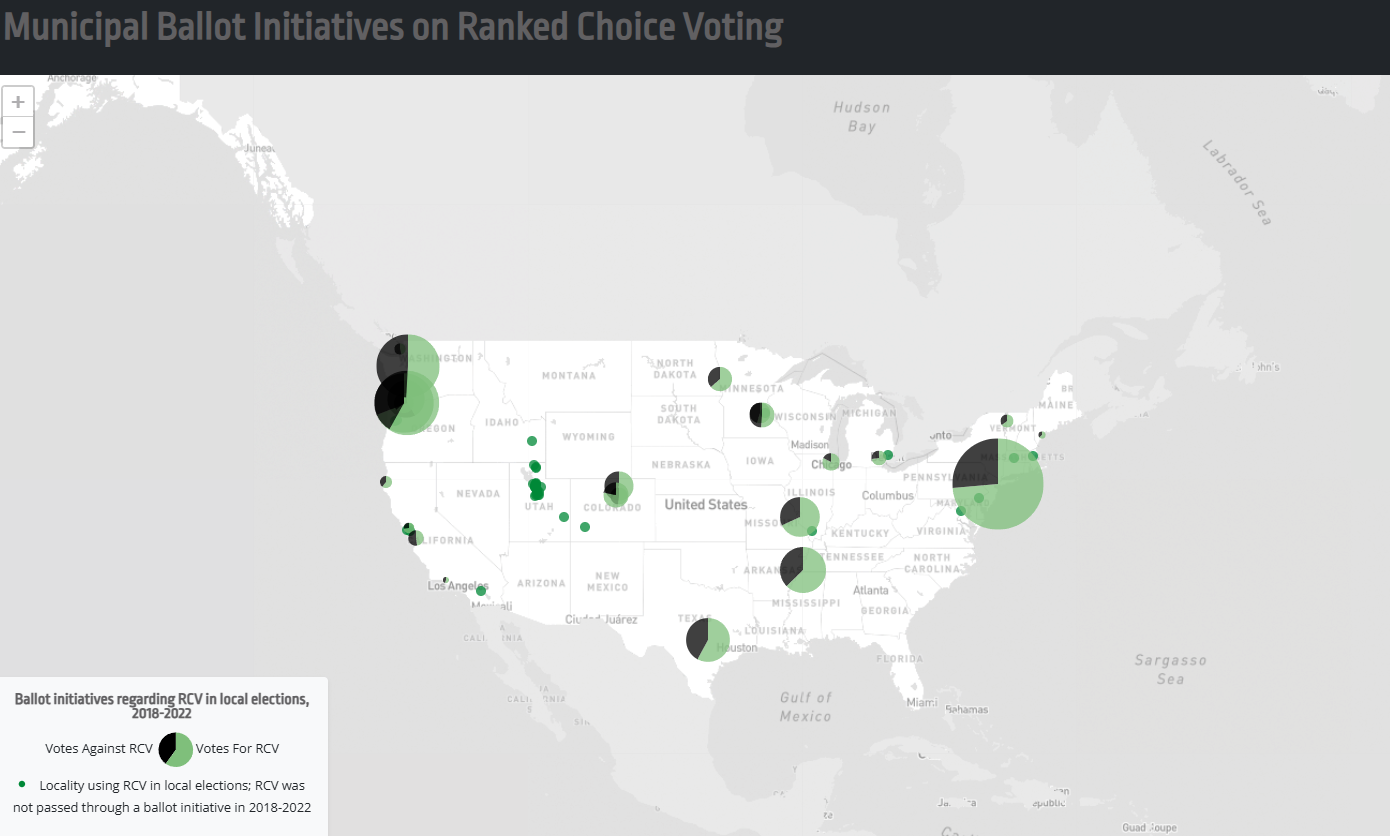
The Success of RCV in Ballot Initiatives
This project, shared with Rank the Vote Ohio, demonstrates the success of Ranked Choice Voting in local ballot initiatives.
Map created in QGIS 3.42.

Scenic Trails Map
Created for the Buckeye Trail Association as part of its effort to gain National Scenic Trail status.

Need Mapping
Created for use in grant applications. Each dot on this map represents a client of Gem City Kitties, a low-cost veterinary clinic. The basemap shows low-income households as a percentage of households, grouped by ZIP code.

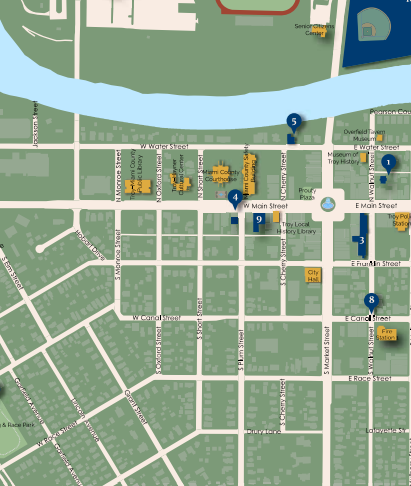
Leaflet Locator
Created for Troy Main Street in Leaflet for use in other mapping applications highlighting member businesses.
African-American History Map
Printed brochure created in conjunction with local Human Relations Commission and local history library.

City Capital Improvements Plan Map
Annual story map of upcoming Capital Improvements Projects (contributor role).